
Weekly Market Analysis 6/30/2024
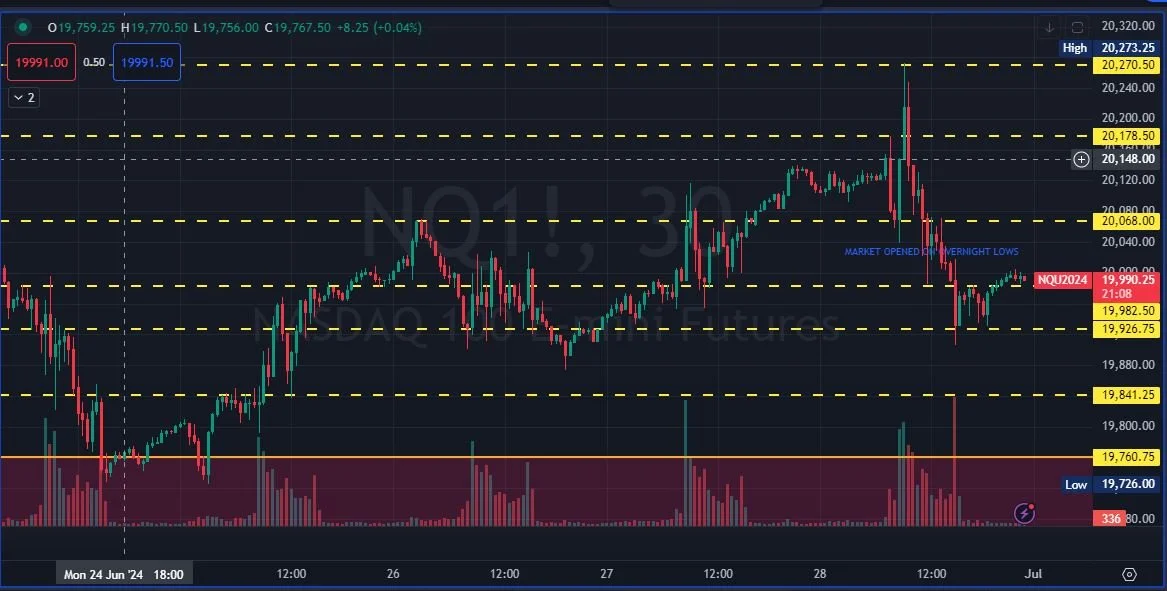
That’s all she wrote on June and Q2. Last week was full of quality trading opportunities and we took advantage of the moves that were presented. Looking back on the week, I mentioned that if we do not fill, or attempt to fill, the gap from the previous contract, that we would take a shot at all time highs once again. We started the week by breaking down towards that level only to find the support was strong around 19,760. Monday night into Tuesday showed us a nice double bottom and a changing of momentum indicating that we would in fact be looking at a bullish week. Price all week respected levels to the upside, pulling back at each level of resistance only to finally pierce through and on upward all the way until the key line in the sand at 20,270.50. Once that level got tagged on Friday, the sellers stepped in a pullback began leading into the weekend. Overall the week started to bring in higher highs and lows potentially looking to continue moving through this week and back into that all time high area.
If you ask ChatGPT what the begging of a new quarter looks like in the indices this is the response you get:
The stock market, including indices like the Nasdaq, often exhibits particular patterns at the start of a new quarter due to several factors. Historically, the reaction in the first week of a new quarter can be influenced by:
Portfolio Rebalancing: Institutional investors and fund managers may rebalance their portfolios at the beginning of a new quarter, leading to increased trading volumes and potential price movements.
Earnings Reports: The start of a new quarter often coincides with the release of corporate earnings reports from the previous quarter. Positive or negative earnings surprises can significantly impact stock prices and overall market sentiment.
Economic Data Releases: Important economic indicators, such as employment reports, manufacturing data, and consumer confidence indices, are often released at the beginning of a new quarter, influencing investor sentiment.
Seasonality: There can be seasonal trends where certain periods of the year tend to perform better or worse due to various factors such as holidays, fiscal year-end activities, and tax considerations.
Historically, the Nasdaq and other indices may show a slight uptick in performance at the start of a new quarter due to these factors, but this is not a guaranteed outcome and can vary widely based on current economic conditions, geopolitical events, and market sentiment.
There is something to be said about the thought behind this breakdown. I was looking for actual statistics when I prompted the question, but really this should be enough. It really does not matter what the percentage of the week change normally is, not with my strategy, however, I do want to think of the drivers that may move the needle in either direction to help me make an educated decision day to day.
This week could be slightly different due to the Holiday shortened/ limited week. With Independence Day being Thursday, that leaves us with really 2 full on trading days. Wednesday is an early close in markets along with the 4th, which is a guaranteed no trade day. Friday, although NFP really is a hangover day and will likely be all algos on low volume. So to say historically speaking this week does anything would be a difficult one to project.
Here are the data releases for the week:
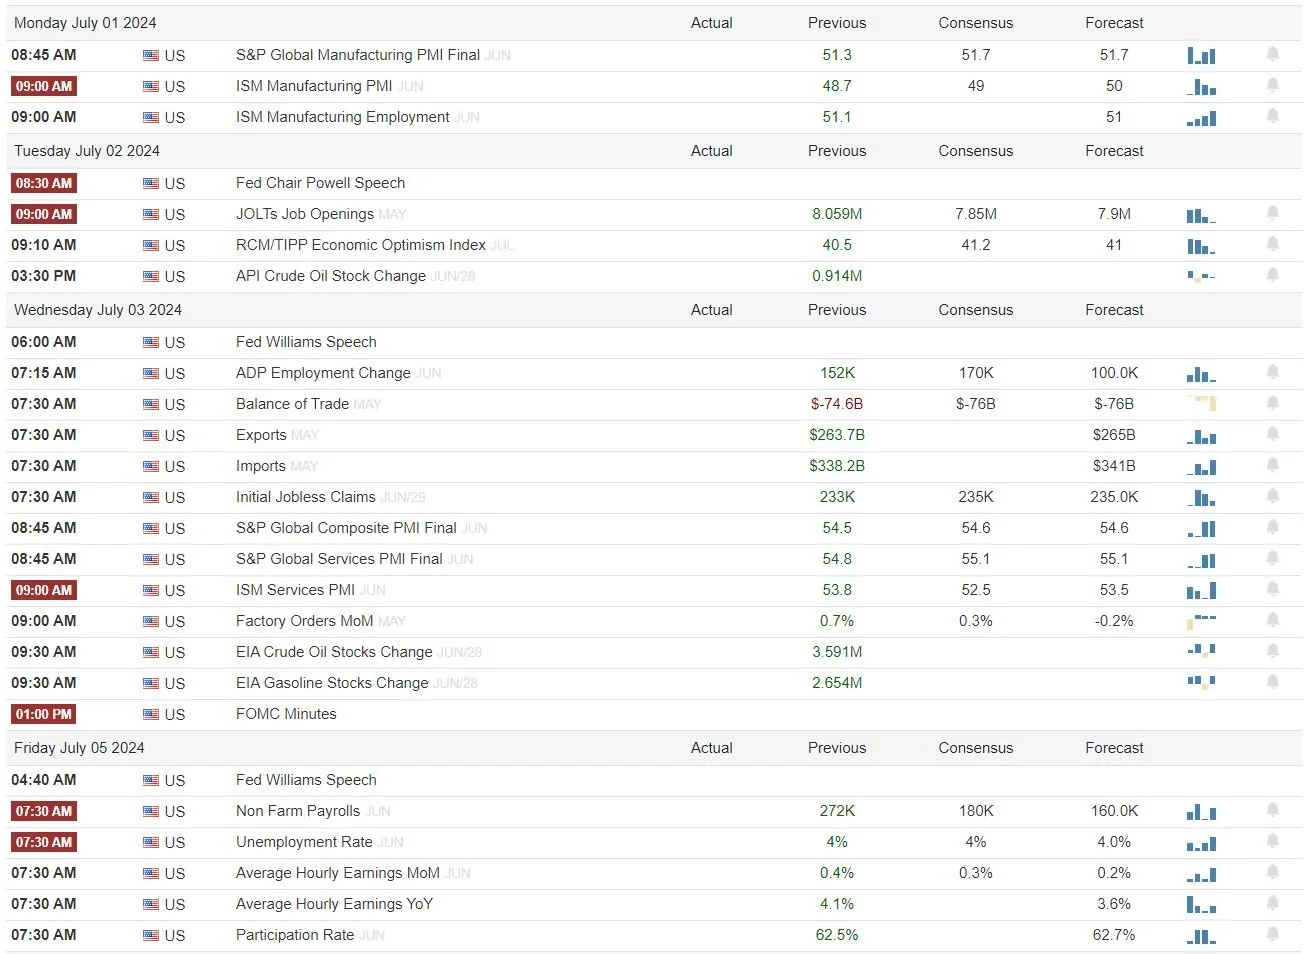
As you can see Monday and Tuesday could give you some direction and movement leading into the holiday portion of the week. With ISM Monday and JOLTS/ JPOW on Tuesday, there will be plenty of data points to drive us into different levels. I could see Monday get choppy early, and then provide a direction later with the number digested and then Tuesday will be a wait and see what JPOW says. This could also lead to a nothing burger that chops around, unless he hints at a cut which then may lead to the move starting while he speaks. Otherwise expect the moves to wait until he is done with his speech.
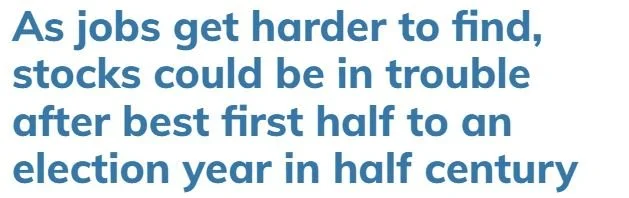
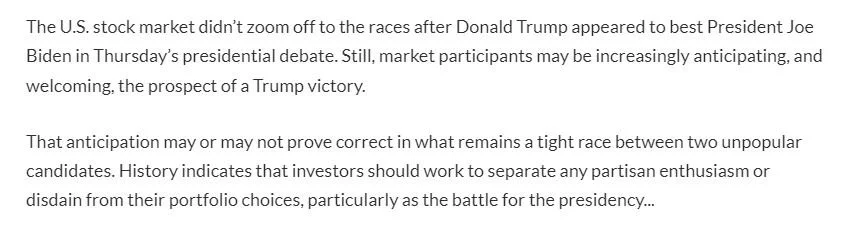
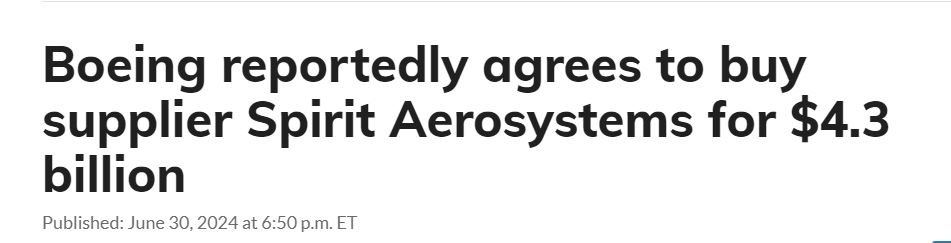
Headlines from the weekend:


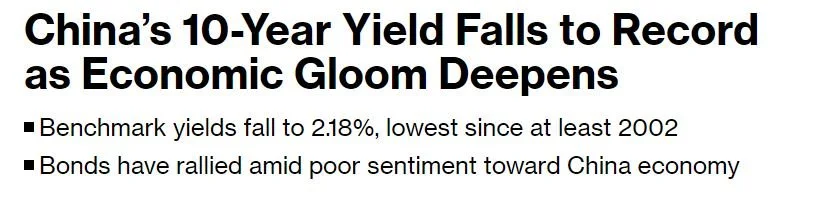
Although it may seem insignificant, understanding global economic information could help us make decisions on our moves within the US markets.

Click the image to see all the fear/greed data points. It is good to note that we are just in a holding pattern and the lack of an extreme one way or the other does not give us any indication on weather we go up or down from here.
Overall this week will be a limited one. I will be on the charts actively Monday and Tuesday and potentially during a small window on Friday post NFP only if that A+ Setup is yelling at me. Otherwise look for opportunity early in the week and enjoy the rest of the week.
Our levels will be the same as last week as we are opening around the same price points with no change in relevant structure.
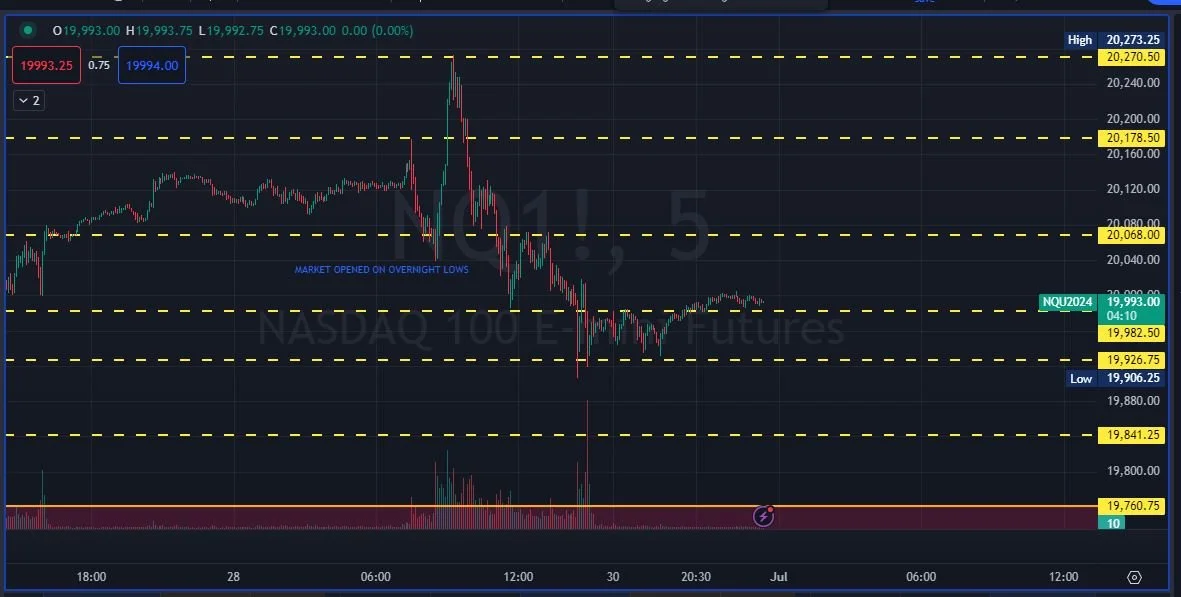
My Bullish/Bearish level for tomorrow morning will be that 19,926.75 level which held into Friday’s close. Below that we see the 19,841.25 and that key support at 19,760.75. Anything below that watch the gap fill. Above we are looking at 20,068 which was key last week and 20,178.50 which acted as resistance. The ultimate level last weeks high was right at 20,270.50 anything over that will lead to all time highs.
STREAM SCHEDULE THIS WEEK WILL BE SHORT BECAUSE OF THE HOLIDAY!
TUNE IN MONDAY AND TUESDAY AND BE SURE TO ENJOY YOUR FREEDOM FOR THE 4TH!
USE CODE “MERICA” FOR 15% OFF ALL WEEK LONG
You can always find my stream on TRADECASTER. Sign up for the 7 Day FREE TRIAL and then keep your access to my room with no charge.
I appreciate you coming and checking the writeup and I would love to hear about what I can do that would improve it for you!!! Fill out the form below and leave some feedback so I can make adjustments and ensure it is worth mine and your time!