
Weekly Analysis 8/4/2024
FOMC week has come and gone and boy, has there been opportunity to trade. Here is the weekly look back before we get into the already moving week ahead. As I mentioned in last weeks writeup, there was plenty of data that would be moving the market. We looked at that gap zone on the top of the chart, the 19,610-19,760 zone as the decision point. My hypothesis moving into the week was for price to test this zone and either reject, as we see happened, or if it were to hold above then all time highs were in store. With the data driven week as well as AAPL, AMZN, AMD, MSFT, META all reporting expanded price action was expected. Price held the low end of the channel on Tuesday and approached the upper end and the gap zone into the FOMC meeting Wednesday. JPOW kept the rates stagnant and reiterated his always neutral stance, not ruling out September cuts and pushing the “dual mandate” rhetoric. Although it appeared that in his words he said the things markets wanted to hear, once the Q&A was complete the selloff began and never looked back. The NFP and Unemployment numbers came out worse than anticipated on Friday which continued the selling momentum. I noted on Friday a larger size order on the books sitting at 18,400, price got front run and held the remainder of Friday. I will go into the gap down later on in the writeup. Take a look at the chart below, compare it to the notes from last weeks writeup, HERE, and see what we were looking for.
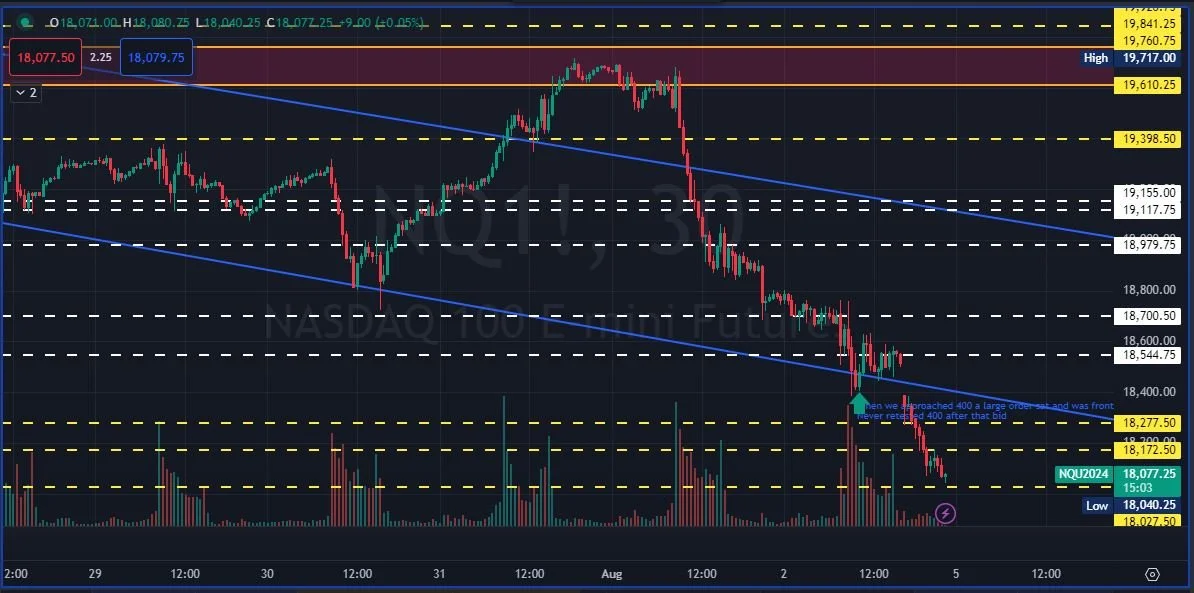
**The Green arrow in the bottom right of the chart indicates the location and the timing of that larger bid on the books. I have a habit of “pricing in” events or things that could be important for me moving forward, I recommend you start to get into this habit to better understand your levels when you look back.
Looking ahead we start with our important data releases for the week:
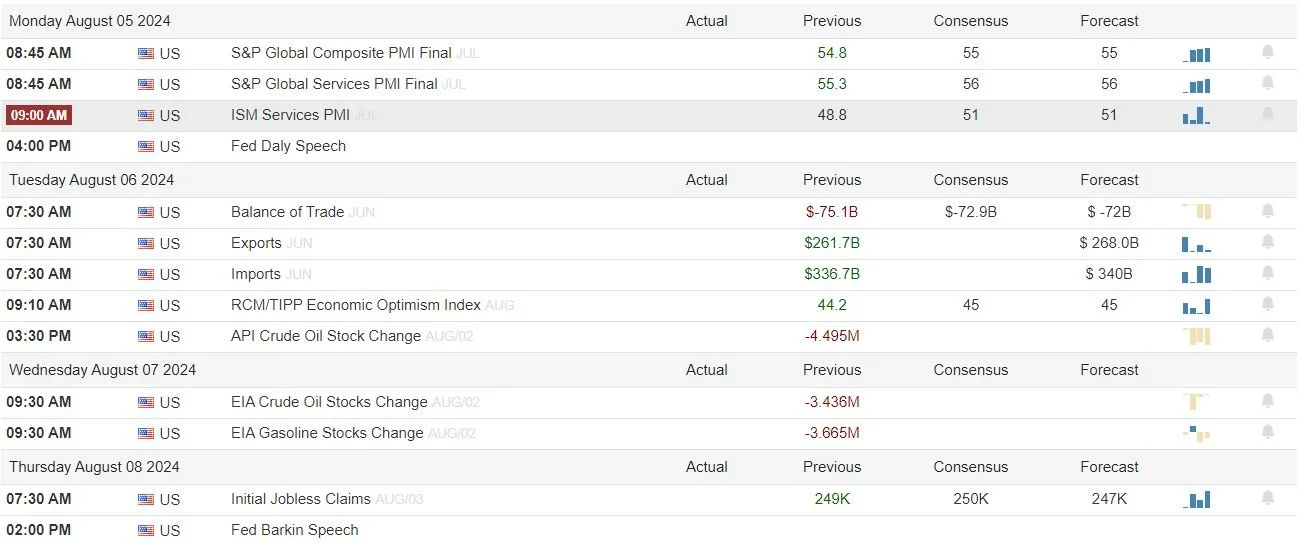
Very light data week, but don’t be fooled, price action early has already shown some expansive behavior. Just note these times for those algo whips and adjust or manage positions accordingly.
Earnings for the week:
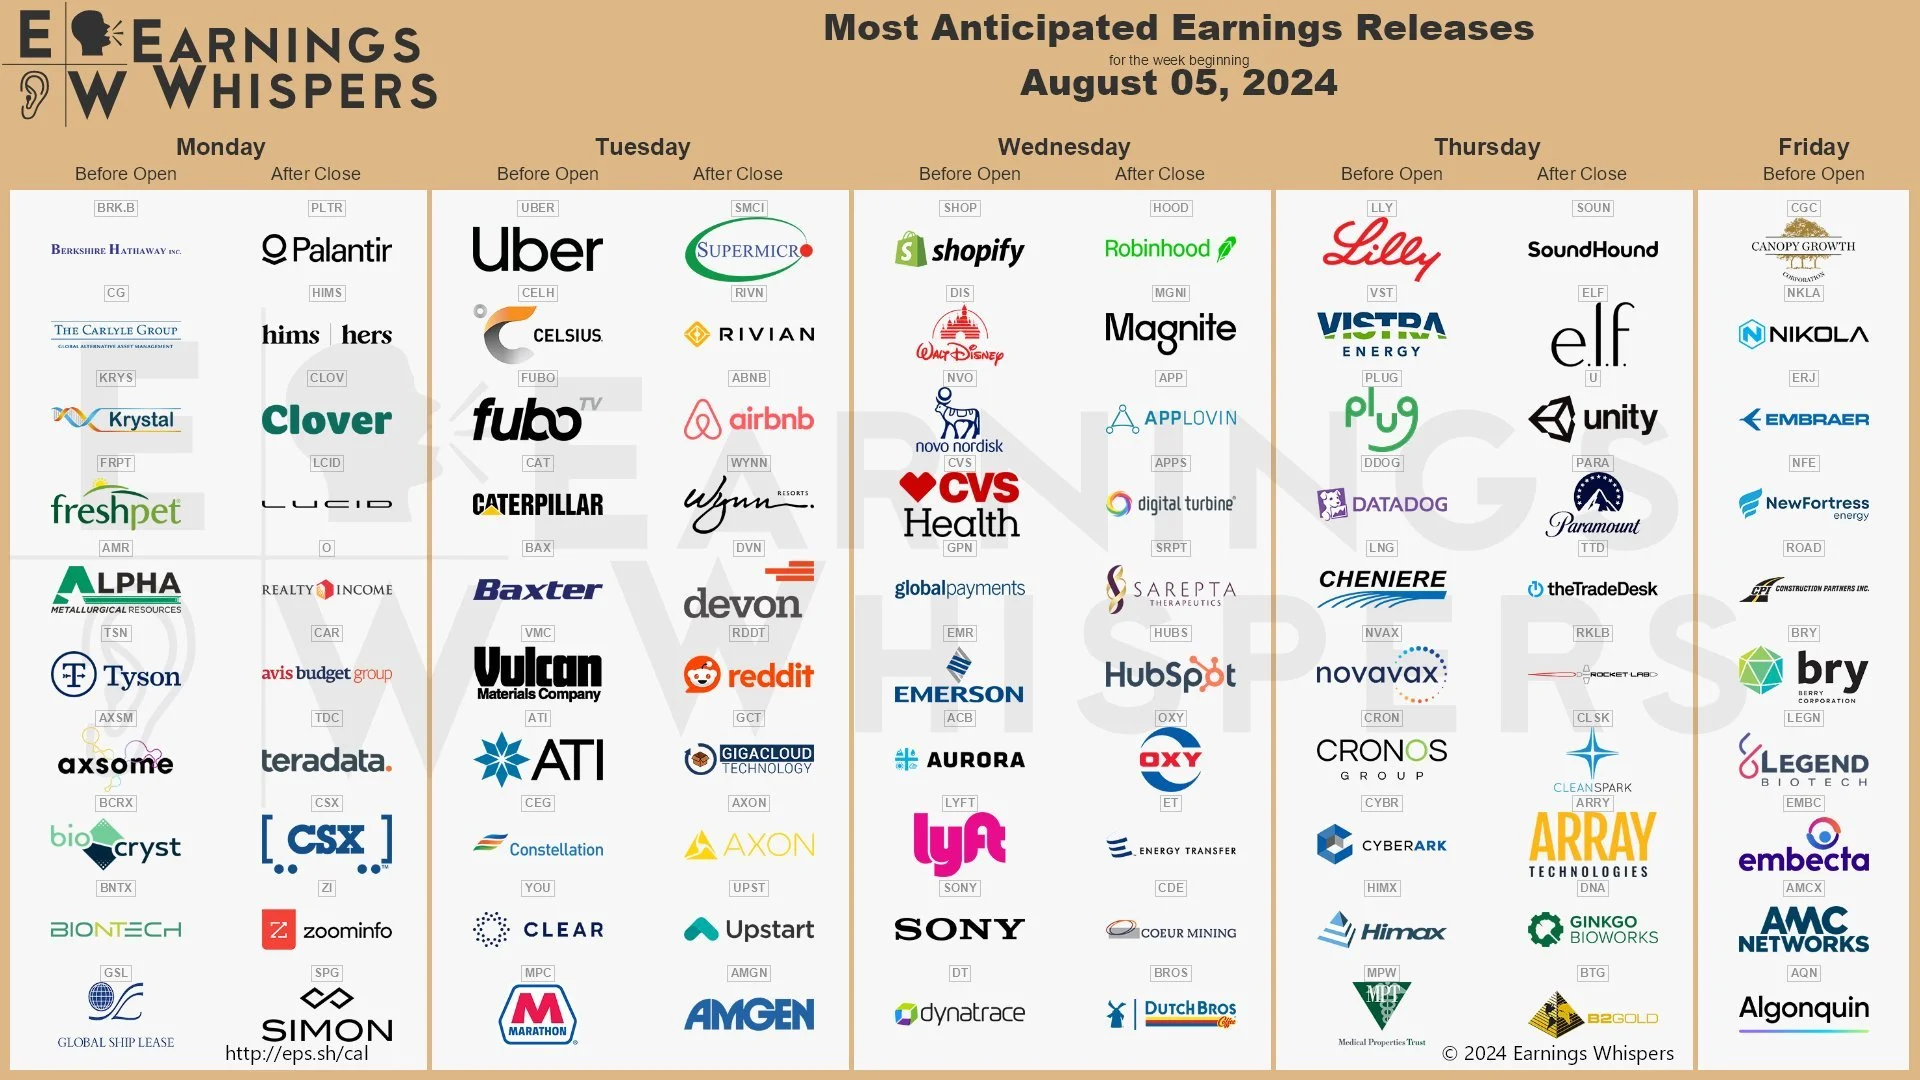
Last week we saw some big names report. This week there are not as many names that would be moving the NQ but I would continue to be in the know of who reports each day and understand what their earnings are saying about the market as a whole. Also, with A.I. being the rage, if any company mixes in that in their guide forward, they could be pushing NVDA up with that, which in turn moves the NQ.
Headlines moving Markets:


Berkshire’s total cash levels surged to a record $277 billion on June 30, up from $189 billion on March 31, largely reflecting big sales of Apple stock in the period. Berkshire reduced its Apple stake by almost 50% to 400 million shares in the quarter. Berkshire sold $77 billion of stocks in the period, mostly Apple

Any natural disaster that may cause impactful damage could send ripples into the markets as well.
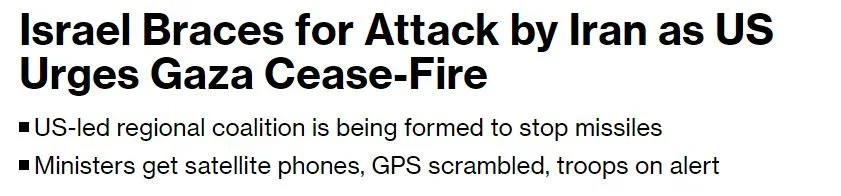
There have been multiple reports that Russian planes have been loading into the Iran airspace. The Israeli forces have taken out the Hezbollah and Hamas leaders this past weekend intensifying the fission between the two nations.
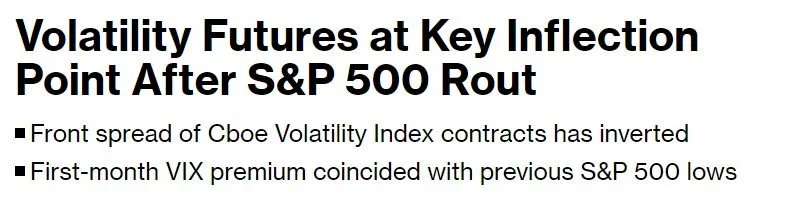
VIX could be signaling a short term bottom. Paired with panic selling into the open of the week that may lead to a quick long opportunity. Check the fear greed index below.

The more this approaches that extreme fear side, the more I am interested in at least a short term bounce. You hear it time and time again, be greedy when people are fearful and be fearful when the masses are greedy. I mentioned this near the top around the CPI print that if the greed keeps coming then a pullback is imminent. Is this a perfect gague, no. However, it is a pretty good guide for knowing when the masses are more scared or more greedy and what some of the big players in the game will feast on.
HERE ARE MY NQ LEVELS TO WATCH FOR THE WEEK:
It is pretty clear that there is still some left over selling pressure from last week as we roll into this new trading week with a gap down. This gap was left from the close on Friday at 18,513.25 to the open here today at 18,390. This gaps us through my key level of 18,400 which held strong into the close on Friday. I did talk on stream Friday that if we failed to hold above the 18,544 level that the sellers could push us into the 18,277 level. The gap and go took us immediately to that 277 and caught an initial pop before continuing to the downside. 18,172 as well as 18,027.50 have also acted as good levels of support turned resistance so we will eye these early in the week. It does appear that the level we sit at while I write this up is the gap fill location of two contract rolls ago (from H to M). This could be our line in the sand point of the overnight, we will have to wait and see how the rest of this session shapes up. Overall if this breaks down and continues to show weakness I will watch the 18,000 down to the 17,829.25 level and even 17,478.75 would be a point of interest. If we get up over the gap and back into that channel upside would be around that 19,155 and past that back to retest the contract gap up at 19,610. OVERALL I SEE OPPORTUNITY ON EITHER SIDE, MAKE SURE YOU LET THE MARKET GUIDE YOU FROM LEVEL TO LEVEL.
Streaming Schedule for the Week Ahead:
Monday 0830-1100 CST
Tuesday 0830-0930 CST
Wednesday 0830-1100 CST
Thursday NO STREAM LAST MINUTE TRAINING
Friday: 0830-1100 CST
Stream can be found here TRADECASTER
and on YOUTUBE
As always if you have any questions or comments about this writeup, my trading, the coffee or just want to say hi, please fill out the form below and leave some comments! Everything I share here is for your benefit, if you would like me to add any information or analyze some other charts please let me know as I will only add something if I am trading it otherwise.